What 456 IPOs Tell Us: Five Things to Check Before You Apply
Reels and tips tell you what to buy. We looked at what actually happened to 456 IPOs instead: who bid, what the companies looked like, and how the shares did on day one. Here is what the evidence says, and how sure we are of each point.
Om Prakash Choudhary · 20 November 2026
What we collected
We collected the bidding and listing-day record of 456 mainboard IPOs listed in India from January 2021 to November 2026. Of these, 330 (72%) closed their first day above the issue price, and the typical IPO closed 11% up.
For each IPO we recorded the anchor book, the subscription by investor type at the end of each bidding day, and the listing-day open and close. For the 294 IPOs listed from 2024 onwards we also collected the company's profit, debt, net worth and value at the issue price.
Every finding below says how many IPOs it rests on, and how sure we are:
| Label | What it means |
|---|---|
| Strong | At least 30 IPOs, right at least 80% of the time, held in every year, and still held in 2025–26 |
| Moderate | A clear, consistent pattern, but below that bar or on a smaller sample |
| Inconclusive | We looked, and the data shows no reliable link |
| Not yet known | We do not yet have the data to test it |
This is about listing day only. It says nothing yet about how an IPO does over months or years.
1. Strong QIB demand meant a positive listing day
Sample: all 456 IPOs. Confidence: Strong.
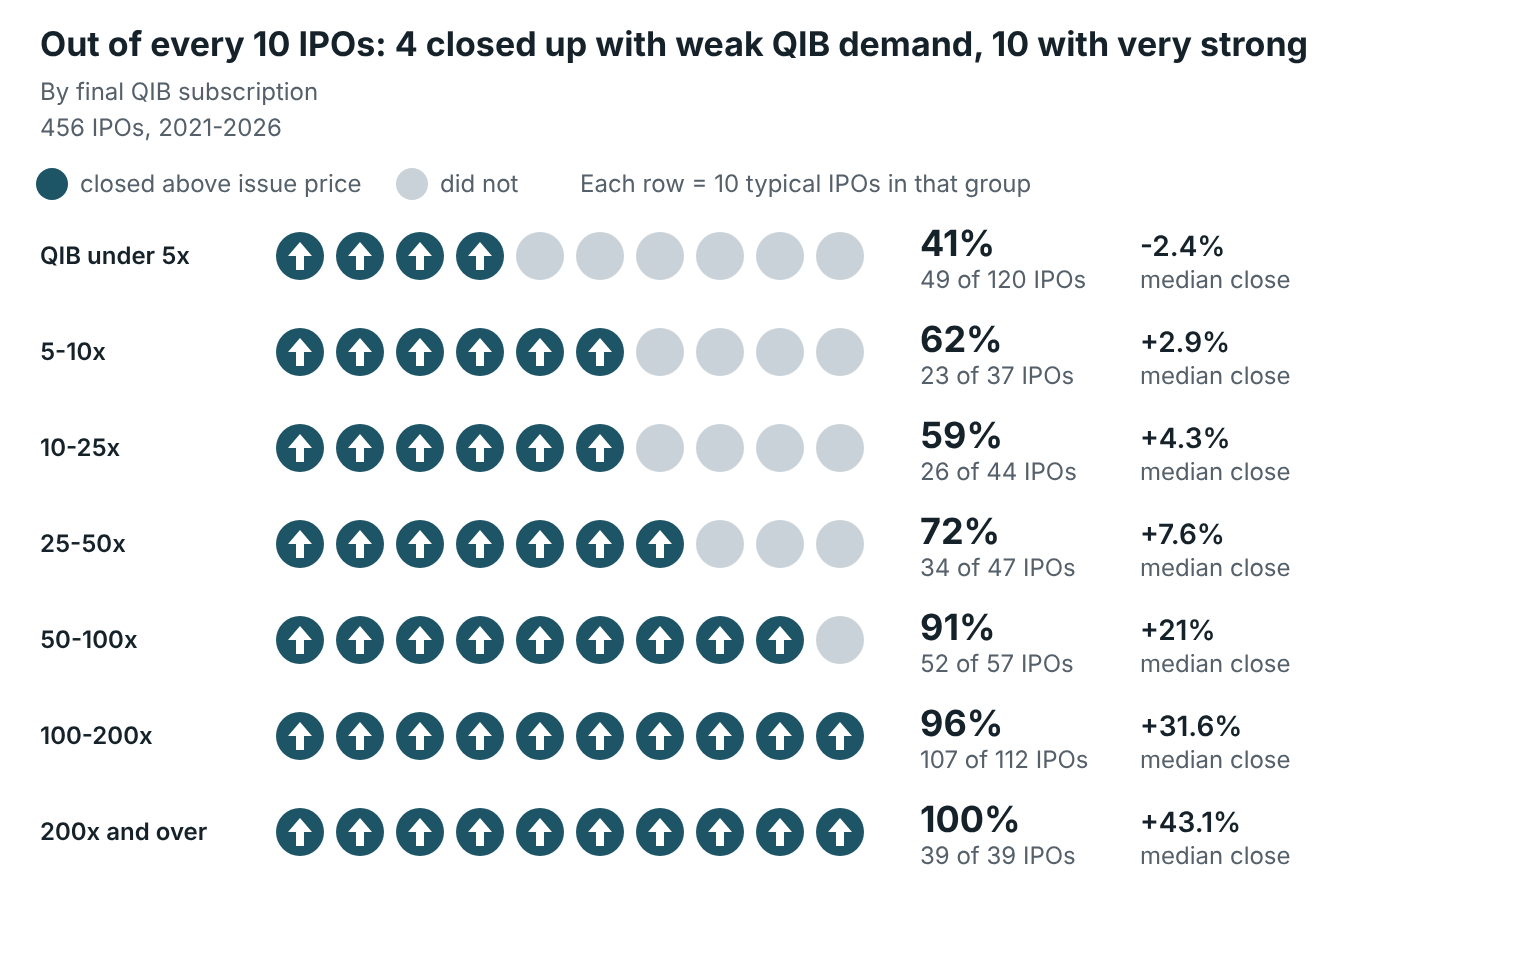
Qualified institutional buyers (QIBs) are mutual funds, insurers, banks and foreign funds. When they bid heavily, the listing day was almost always positive. Of the 151 IPOs where QIBs bid 100 times or more, 146 closed up. All 39 IPOs with QIB demand of 200 times or more closed up.
The reverse also holds. When QIBs bid less than 5 times, fewer than half (41%) closed up, and the typical one closed slightly below its issue price. Weak QIB interest was a warning sign, not a neutral one.
2. QIBs bid mostly on the last day, but Day 2 already gives a signal
Sample: 452 IPOs with Day 2 figures. Confidence: Strong.
In the typical IPO, the QIB portion was subscribed 0.08 times at the end of Day 1, 0.6 times at the end of Day 2, and 39 times at the close. Nearly all institutional money arrives in the last hours. A low QIB figure on Day 1 or Day 2 is normal and tells you little on its own.
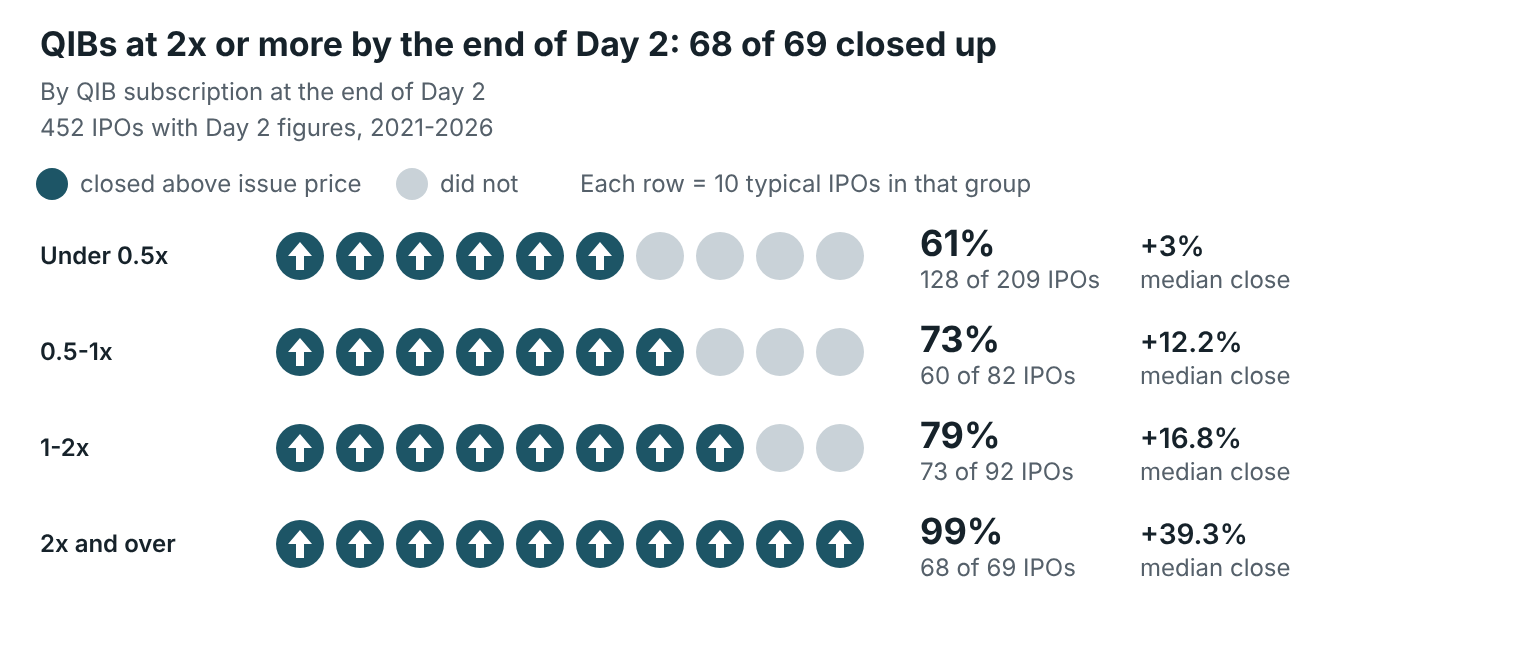
The exception is when QIBs move early. When the QIB portion was already subscribed 2 times or more by the end of Day 2, 68 of 69 IPOs closed up, and the typical one closed 39% up. That was the clearest signal in the whole dataset that an investor could see before bidding closed.
3. NII demand adds to QIB demand
Sample: all 456 IPOs. Confidence: Moderate.
Non-institutional investors (NIIs, often called HNIs) bid above ₹2 lakh. Their demand mattered on top of QIB demand.
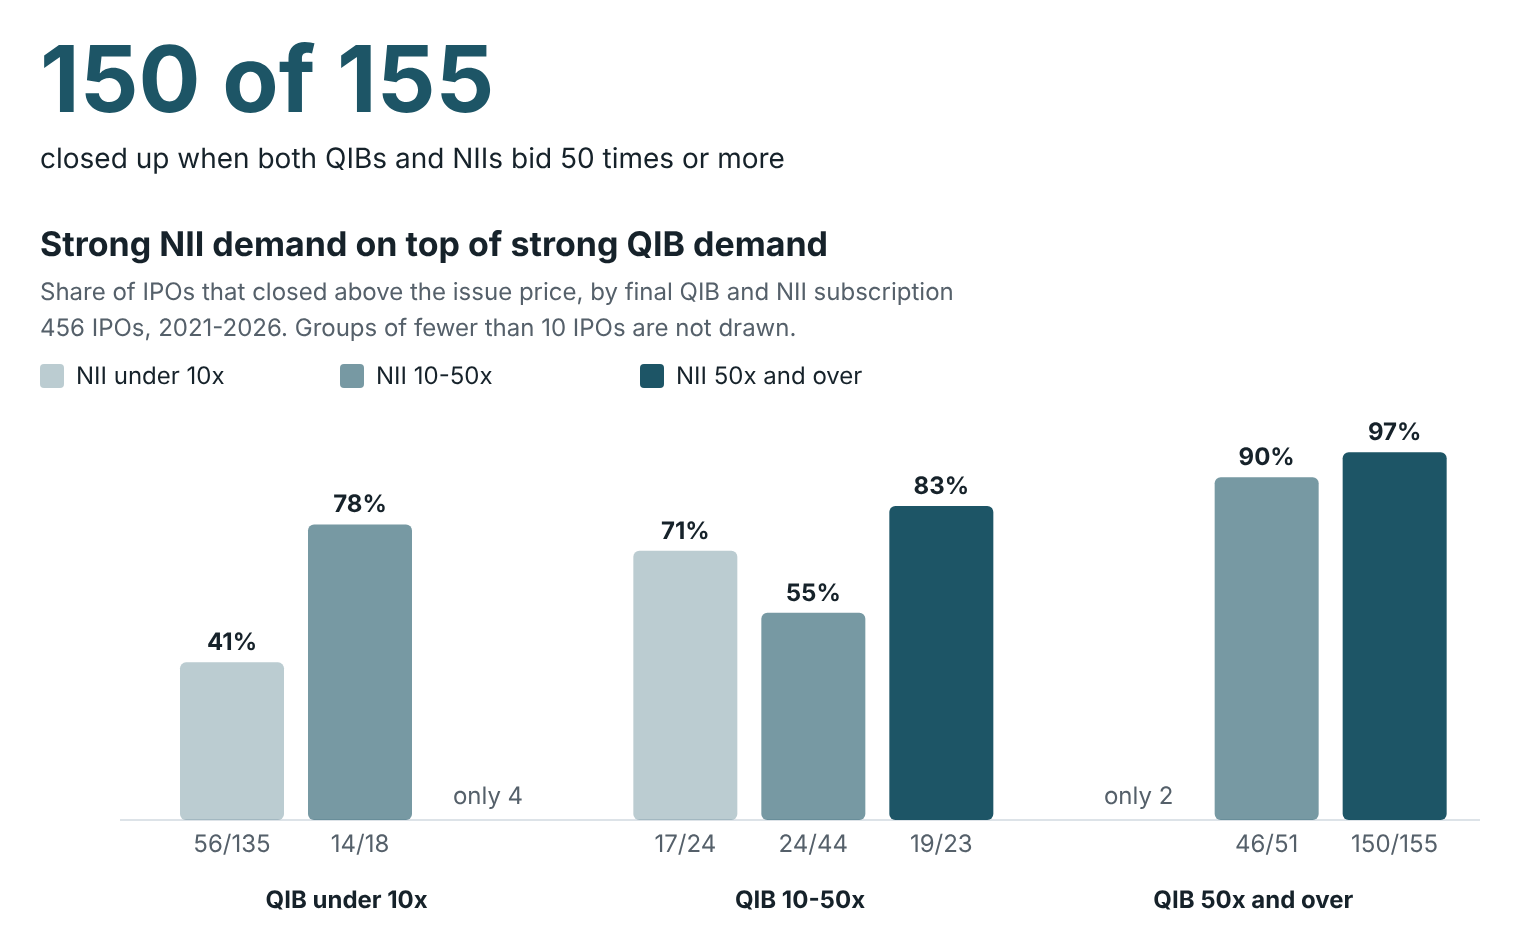
- When QIBs bid 50 times or more, strong NII demand (50 times or more) lifted the success rate from 90% to 97%. Across the dataset, 108 of the 110 IPOs with NII demand of 100 times or more closed up.
- When QIBs bid less than 10 times, IPOs that still drew NII demand of 10–50 times closed up 78% of the time, against 41% when NIIs also stayed away. This rests on only 18 IPOs, so treat it as a hint, not a rule.
- In the middle band (QIB 10–50 times) the pattern does not hold neatly. We call this part inconclusive.
One honest limit: NII and retail demand rise and fall together, so the data cannot tell us whether HNIs or retail investors move the price.
4. What QIBs look for in a company
Sample: 294 IPOs listed 2024–26. Confidence: Moderate.
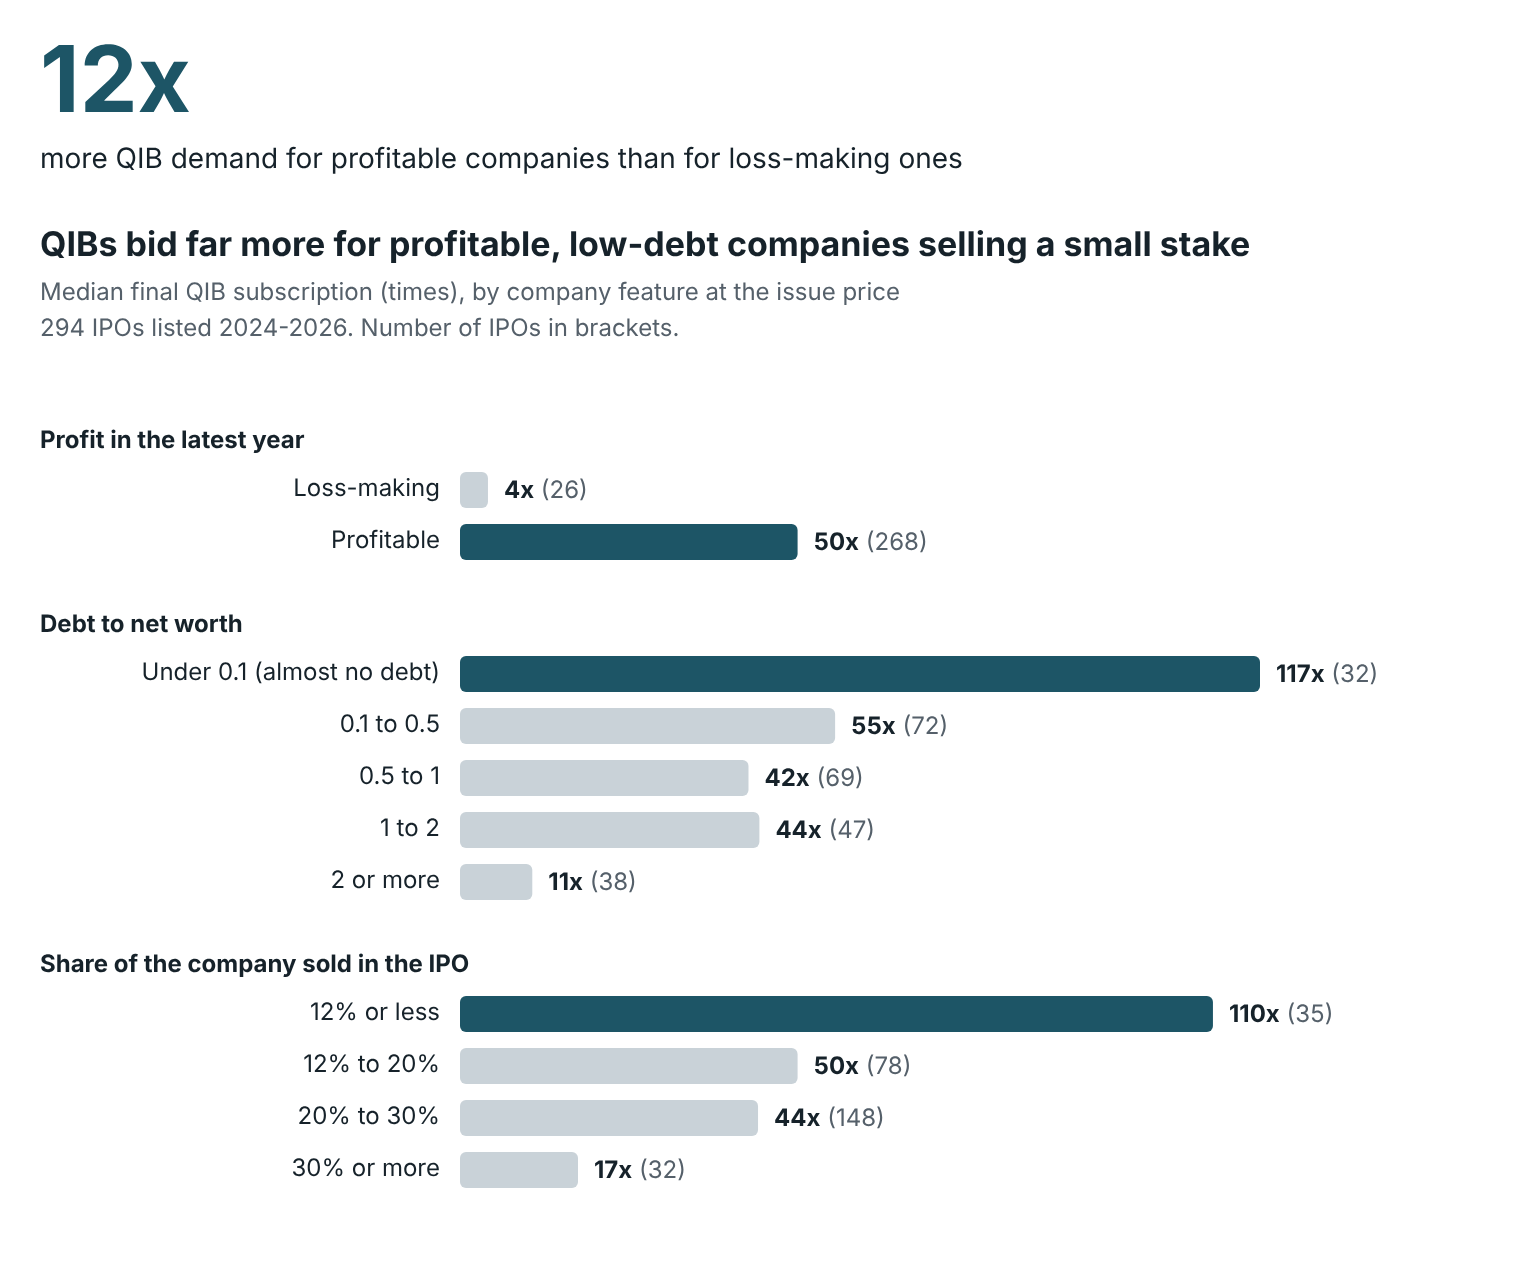
- Profit. Loss-making companies drew a median QIB demand of 4 times; profitable ones drew 50 times.
- Debt. Almost debt-free companies drew 117 times. Companies with debt of twice their net worth or more drew 11 times.
- How much of the company is on sale. When the IPO sold 12% of the company or less, QIBs bid a median 110 times. When it sold 30% or more, they bid 17 times.
Tested together, being profitable and selling a smaller stake mattered most. Profit margin, sales growth and return on net worth added little once those were known. And the limit is important: company figures explained only about one-sixth of the differences in QIB demand. The rest comes from things we did not measure, such as the sector, the brand, market mood and the anchor list.
5. P/E and valuation: no link to the listing day
Sample: 294 IPOs listed 2024–26. Confidence: Inconclusive.
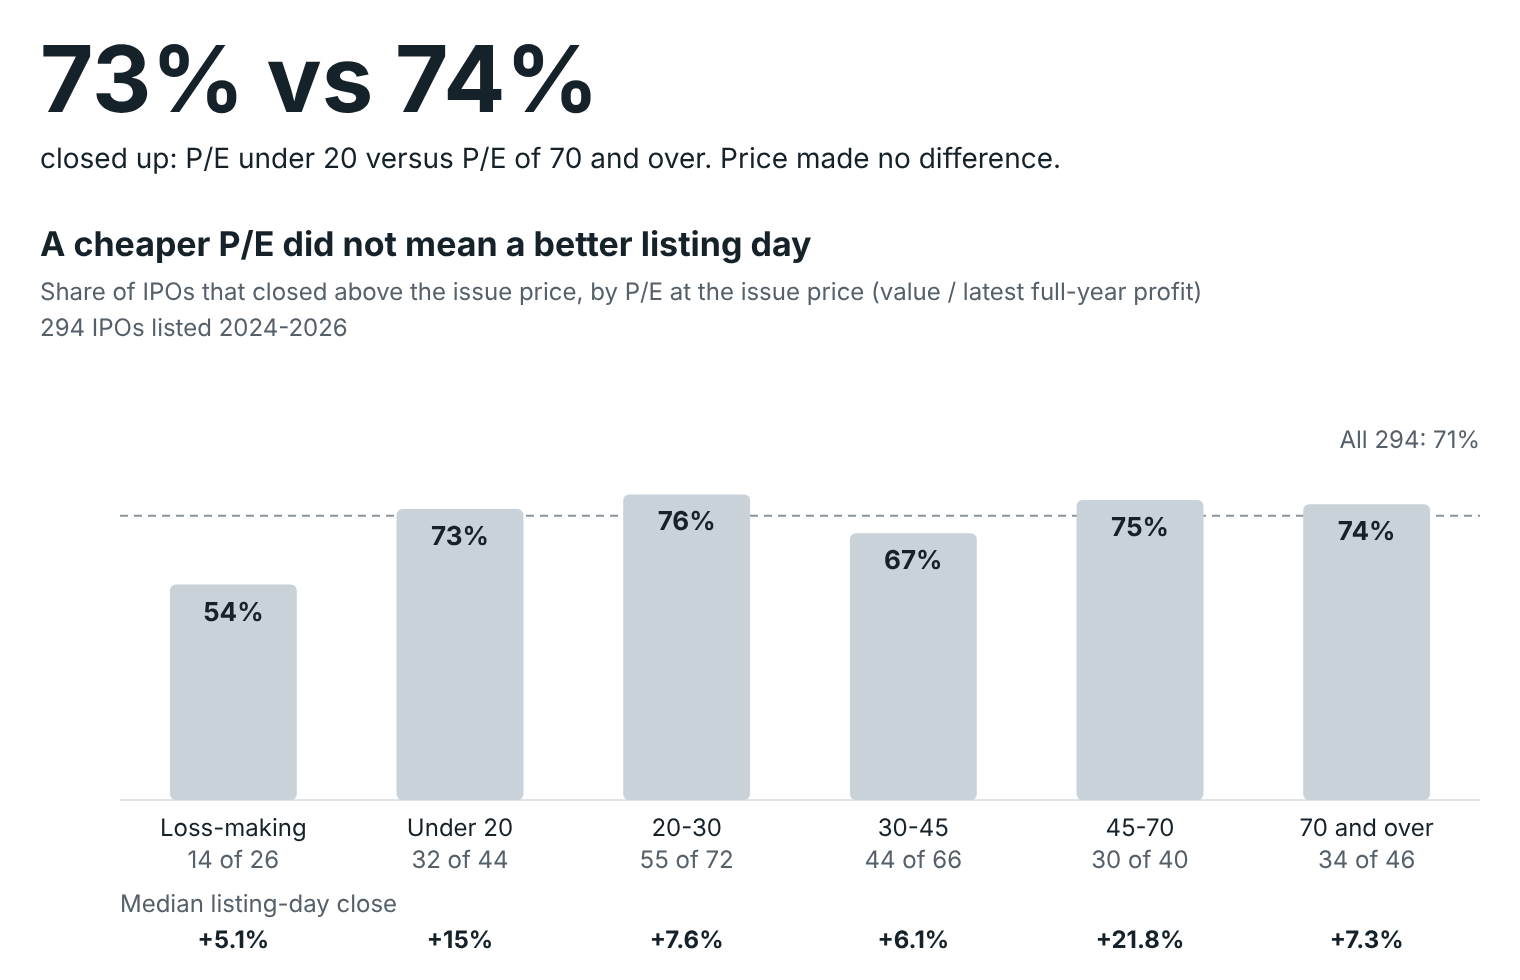
We expected cheaper IPOs to list better. They did not. IPOs priced at under 20 times earnings closed up 73% of the time; IPOs priced at 70 times or more closed up 74% of the time. Price-to-book showed the same lack of pattern. Only loss-making companies clearly lagged: 14 of 26 closed up.
This does not mean valuation is unimportant. It means listing day is driven by demand, not price. Whether expensive IPOs do worse over the following months is a separate question we have not yet tested. Many published P/E figures use part-year profit, so we worked out P/E ourselves from the latest full year.
6. Very large companies, selling a small slice, listed well
Sample: 294 IPOs; the finding rests on the 30 largest. Confidence: Strong, but on a small group.
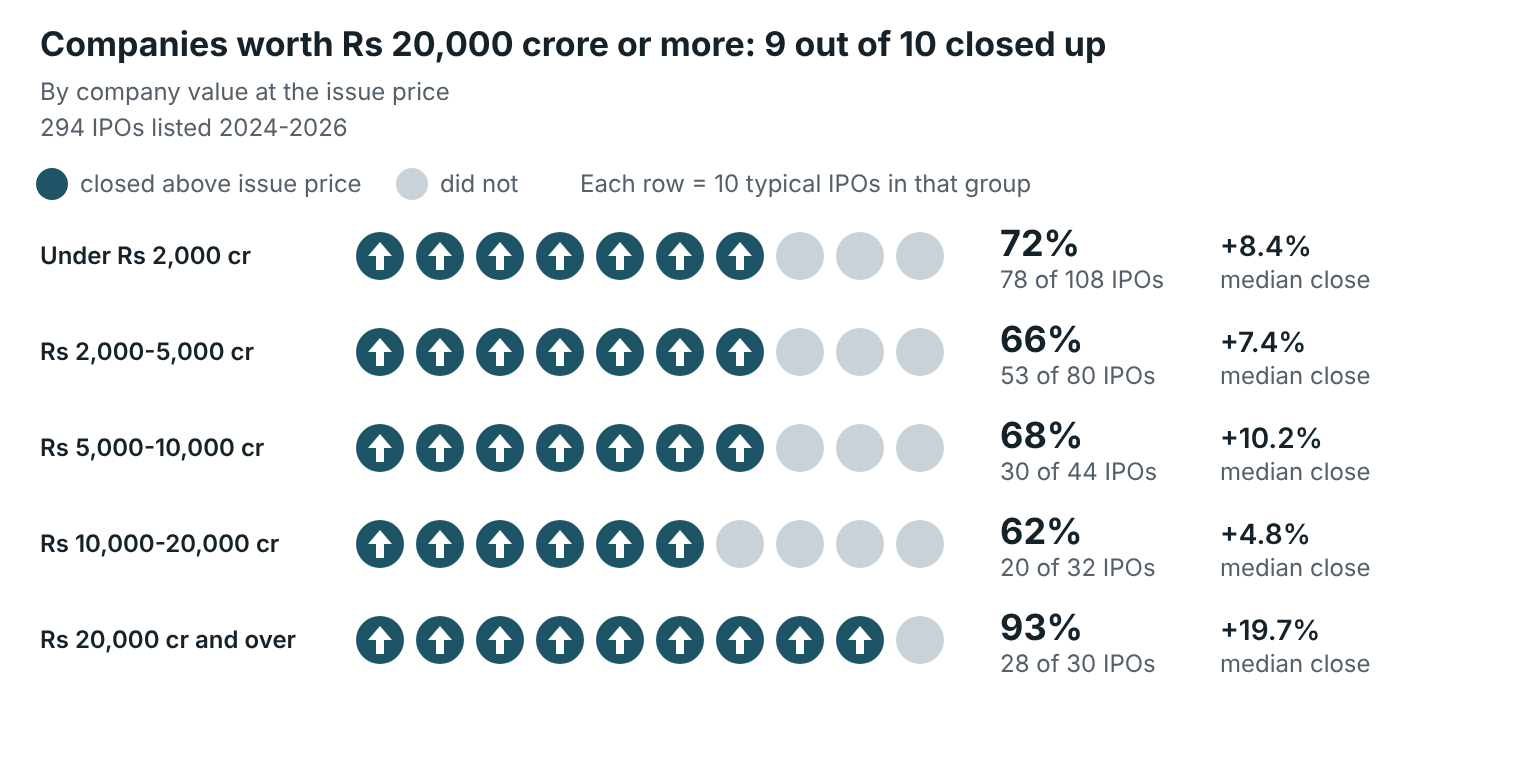
Companies valued at ₹20,000 crore or more at the issue price closed up 28 times out of 30, and held that record in every year. When the IPO sold 12% or less of the company, 31 of 35 closed up. When both were true, all 17 closed up.
It is not a guarantee. The biggest IPO in the group, Hyundai Motor India, closed 7% below its issue price. And 30 companies is a small base.
7. The market has cooled: the same demand now buys a smaller gain
Sample: all 456 IPOs. Confidence: Strong.
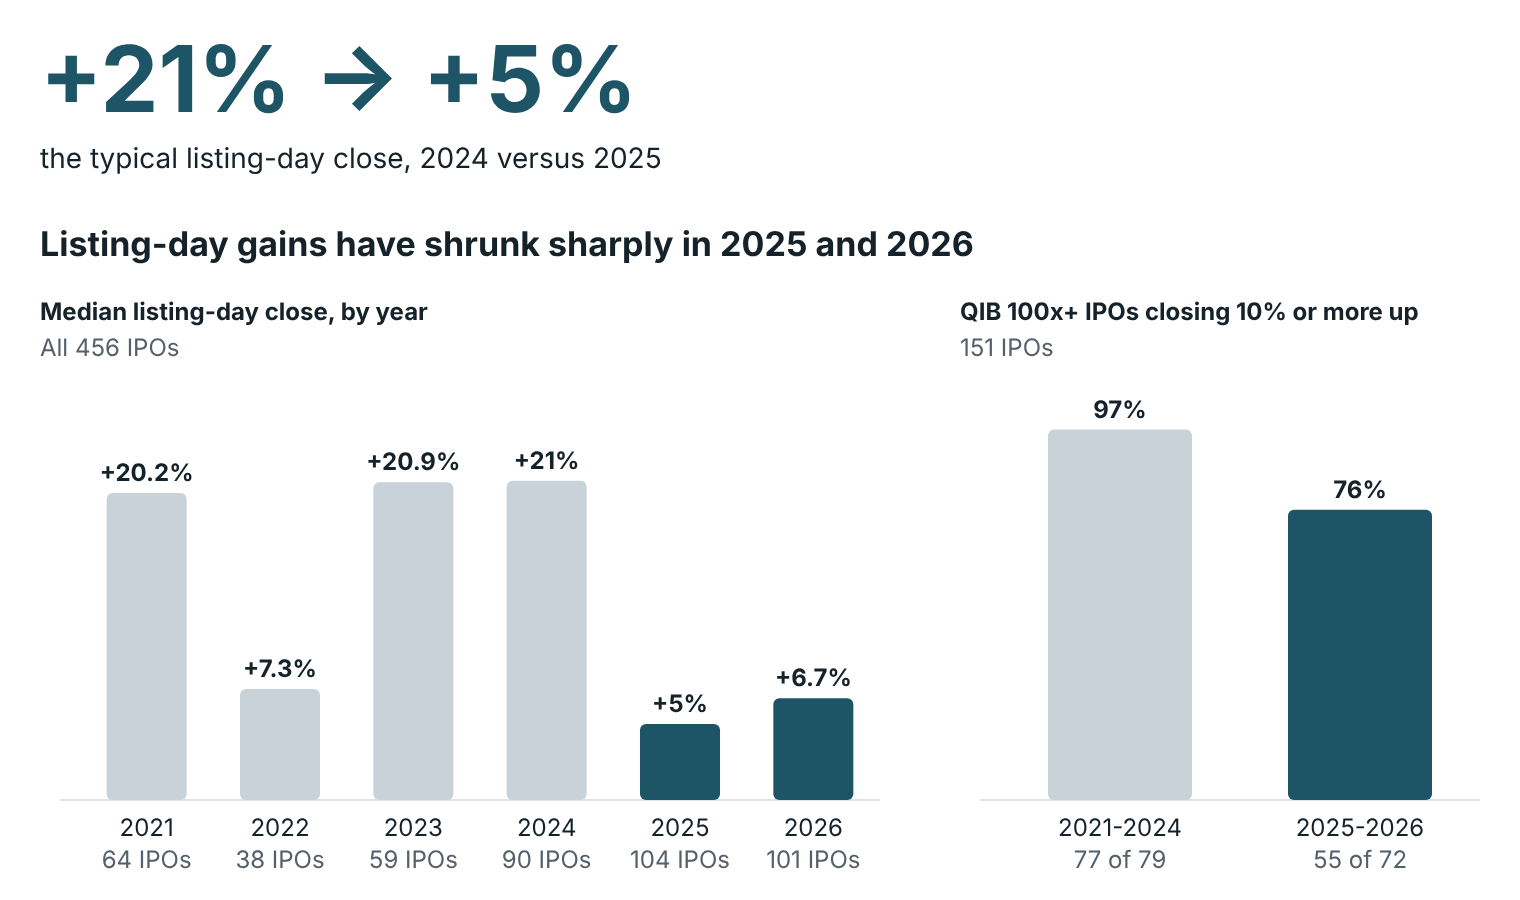
In 2021, 2023 and 2024, the typical IPO closed about 20% up on listing day. In 2025 it was 5%, and in 2026 so far 7%. Even among IPOs where QIBs bid 100 times or more, 77 of 79 closed at least 10% up in 2021–24, but 55 of 72 in 2025–26. Any rule of thumb built on the 2021–24 boom should be discounted today.
8. For those allotted shares: the opening price set the day's direction
Sample: all 456 IPOs. Confidence: Strong.
In 87% of IPOs, the stock closed on the same side of the issue price as it opened. Of the 223 IPOs that opened 10% or more above the issue price, 222 also closed above it. Whether a big opening jump grew or faded during the day was close to a coin toss.
What we cannot say yet
- Long-term returns. Whether stronger companies or cheaper IPOs do better over 3, 6 or 12 months. Not yet known.
- Related-party transactions, criminal cases, debt taken for acquisitions, organic versus acquired growth. These sit inside the offer document; we plan to test them by running past offer documents through our review engine. Not yet known.
- Who moves the price, HNIs or retail. Their demand moves together. Inconclusive.
- Which IPOs will fall. No rule reliably picked losers. The closest: NII demand under 2 times on an issue below ₹1,000 crore, where 28 of 36 closed down. Moderate, small sample.
Five things to check before you apply
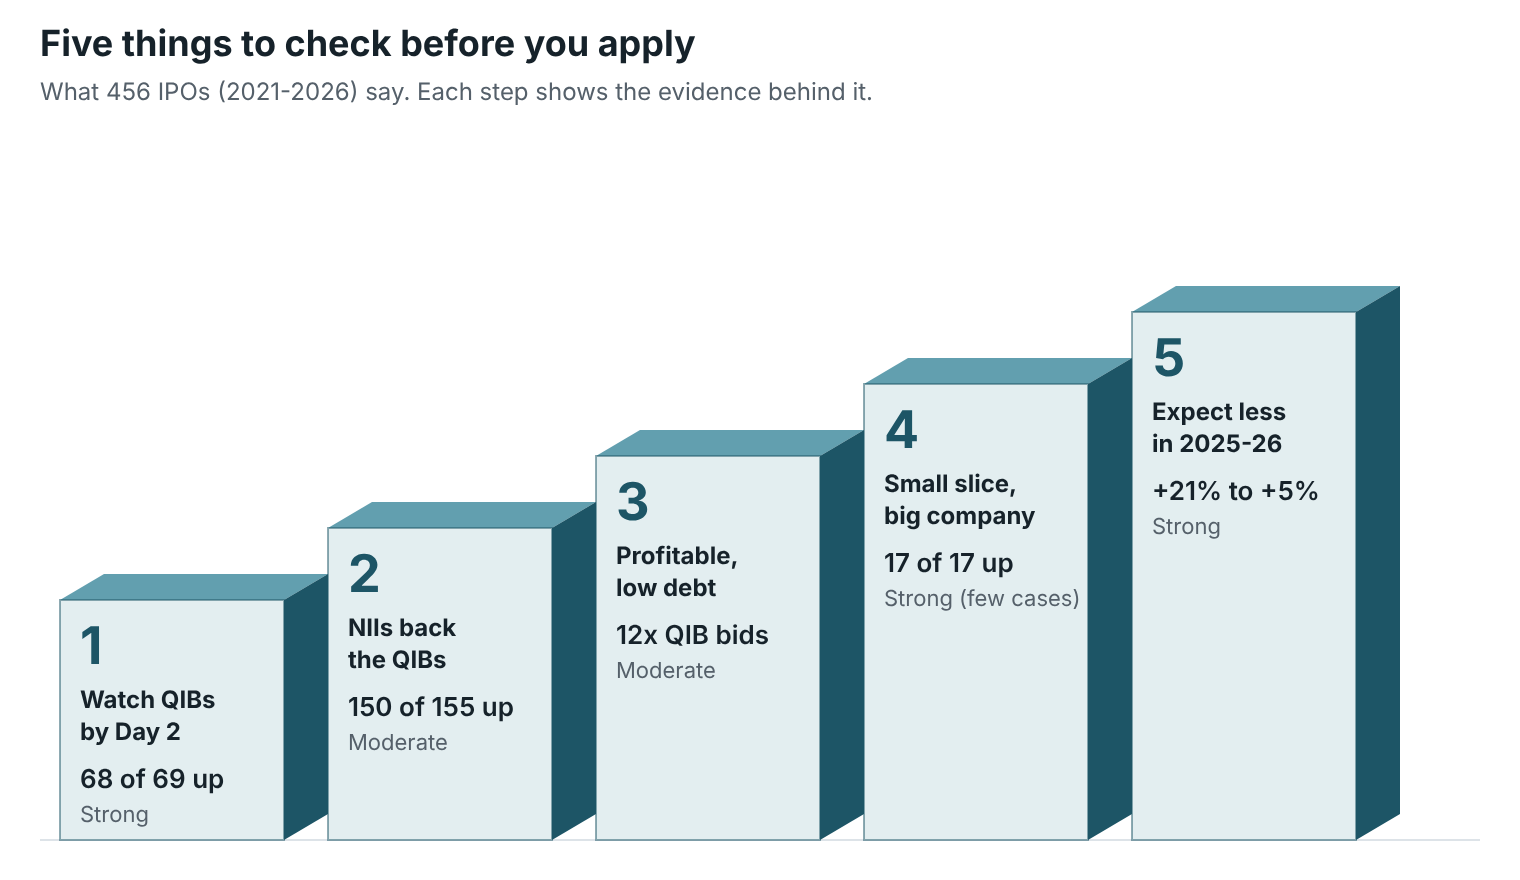
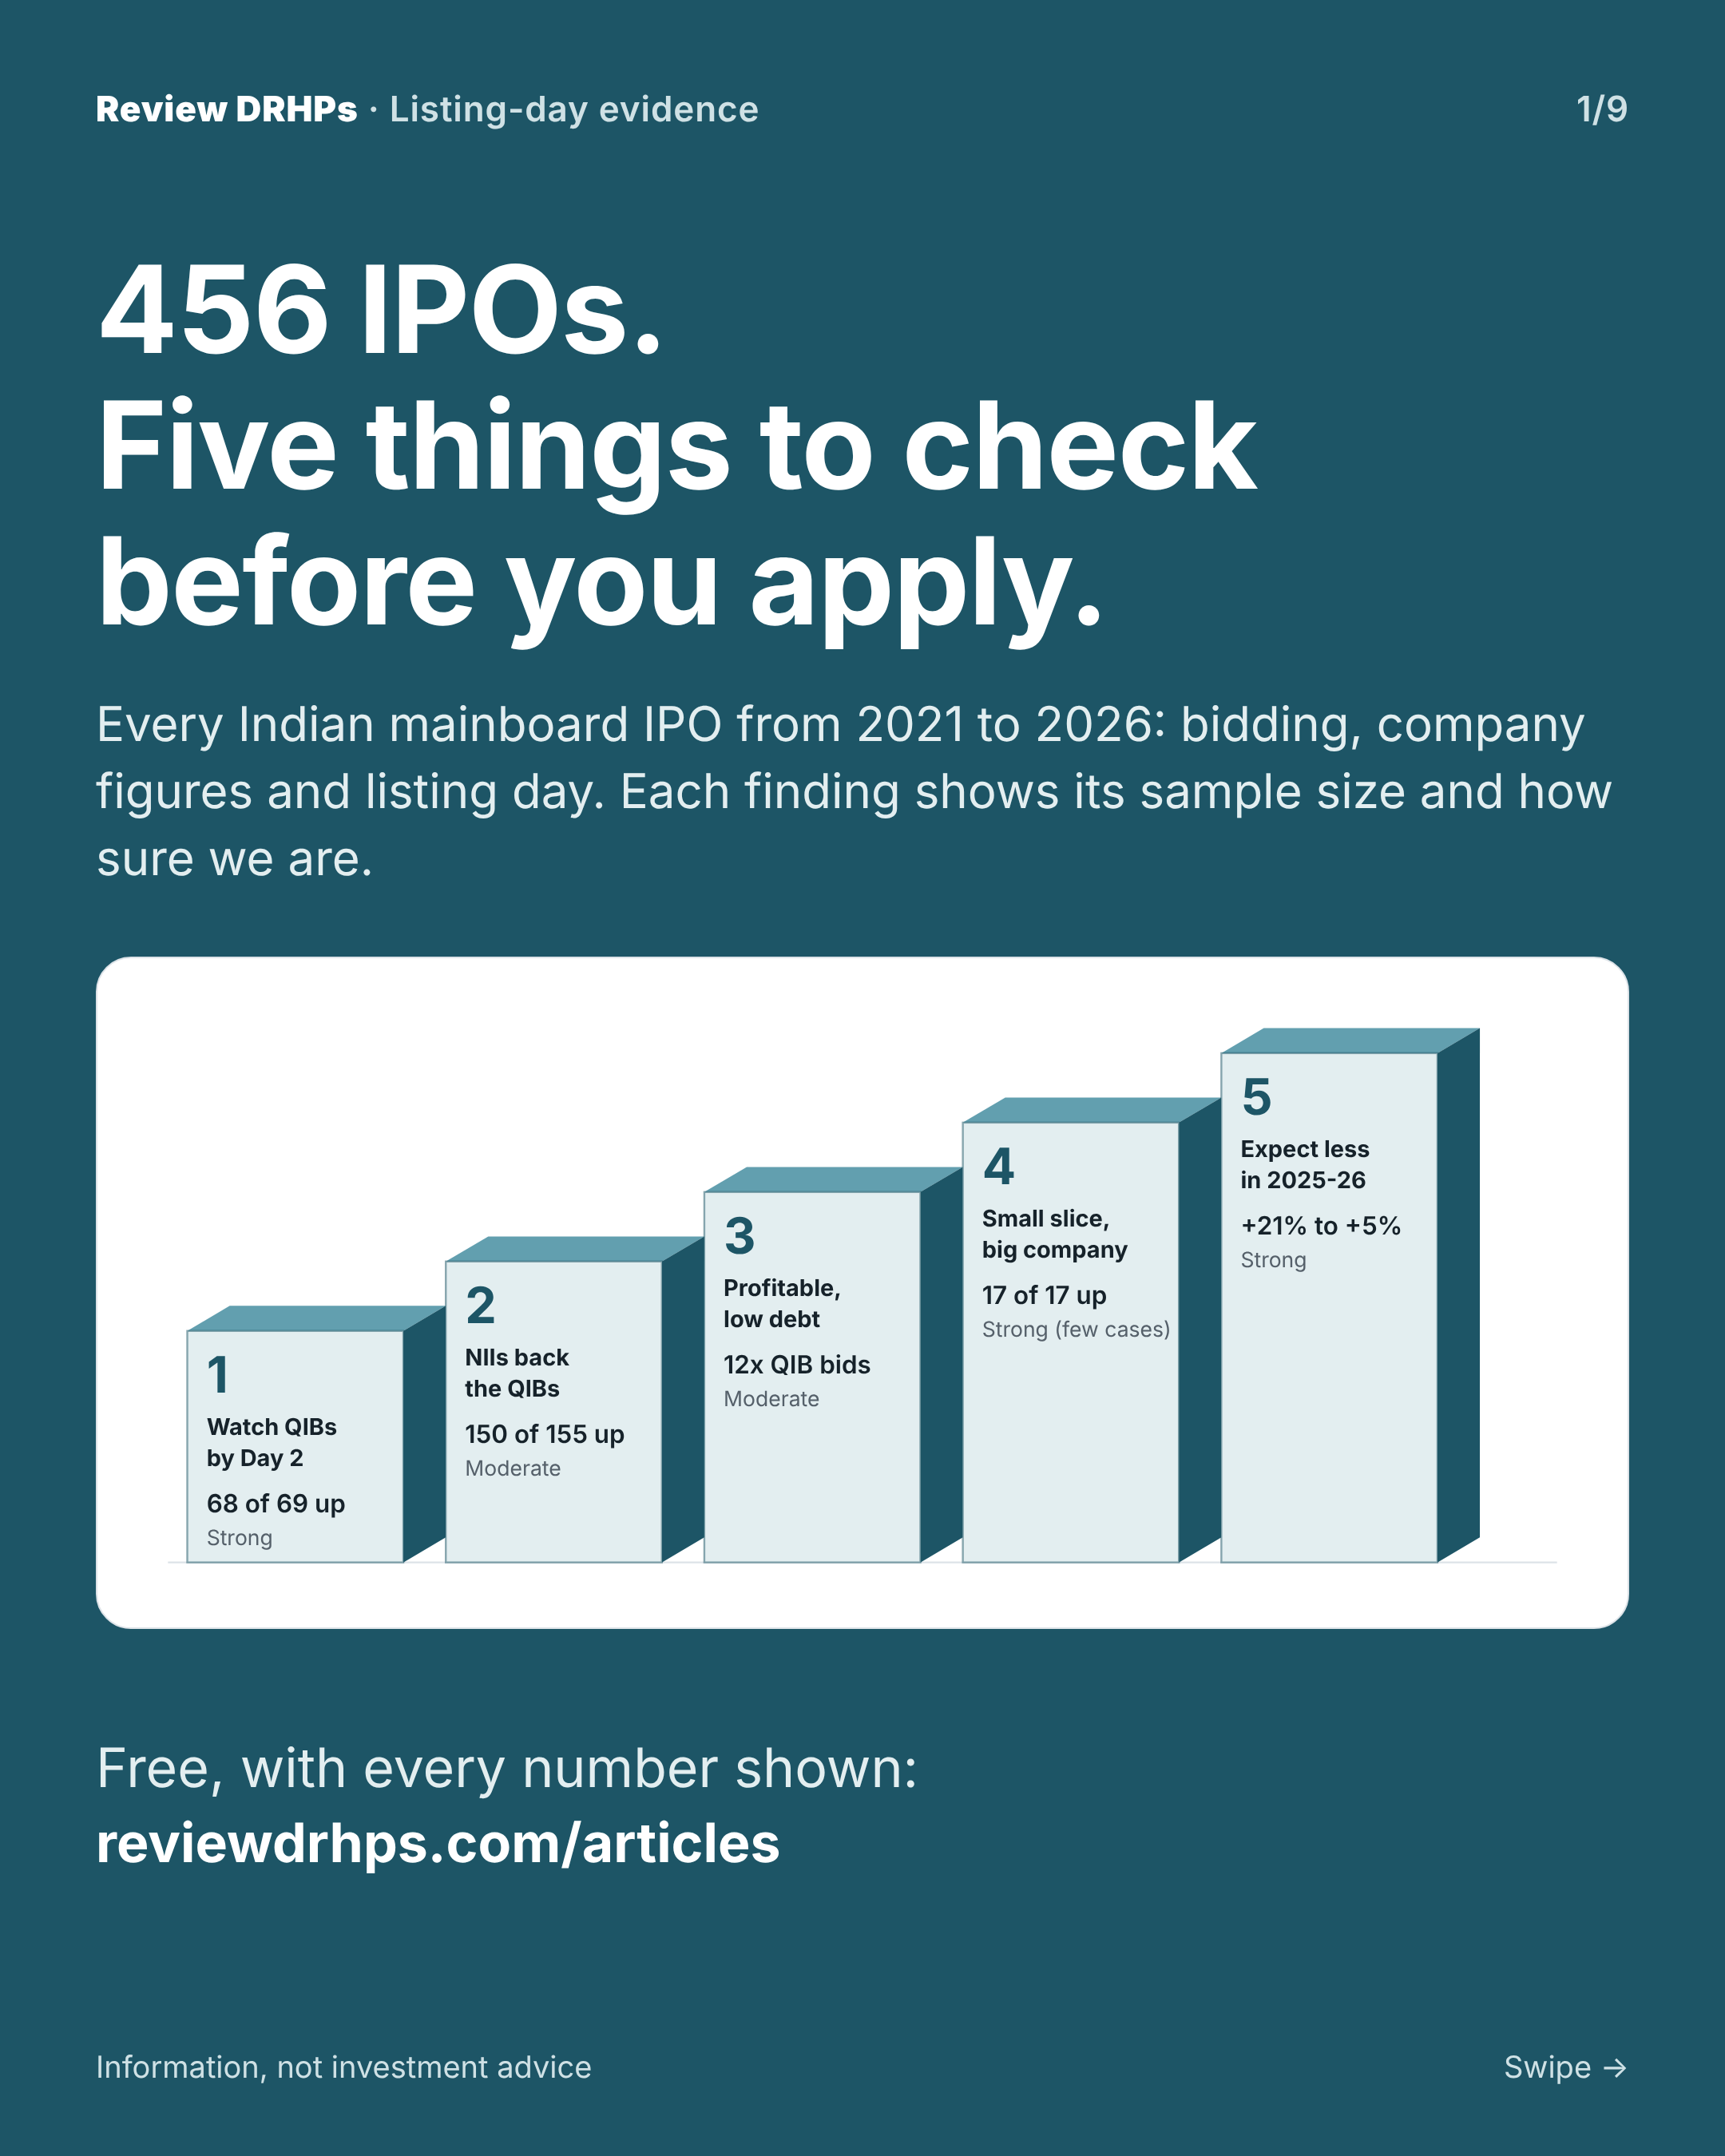
Across 456 IPOs, one thing decided the listing day more than anything else: how much the institutions wanted the shares. The price tag did not.
- Watch the QIB figure, especially at the end of Day 2. QIBs at 2 times or more by then: 68 of 69 closed up. Final QIB demand of 100 times or more: 146 of 151 closed up. Under 5 times: fewer than half did. Strong.
- Check that NIIs agree with the QIBs. Heavy QIB and heavy NII demand together: 150 of 155 closed up. Moderate.
- Check that the company makes a profit and is not heavily borrowed. Institutions bid about 12 times more for profitable companies, and about 11 times more for almost debt-free ones than for heavily indebted ones. Moderate.
- Check how much of the company is being sold. A small slice of a large company was the most reliable profile we found: 17 of 17 closed up. Strong, small sample.
- Lower your expectations for 2025–26. The typical listing gain has fallen from about 20% to 5–7%. Strong.
Do not rely on a low P/E to make an IPO list well. In our data it made no difference. These findings describe where the odds have been, not what will happen. They are a reason to read the offer document, not a substitute for it.
Read the document, not the reels
Bidding numbers tell you what others think. Only the offer document tells you what you are buying. Most investors never open it: it runs to hundreds of pages, and reels and tips fill the gap, usually with opinion and no source. We built three sites to close that gap. Each finding quotes the company's own filing and gives the page number, so you can check it yourself.
- Review DRHPs reviews Indian IPO documents. It shows which points to read closely and which are worth checking, explains the track record, and sets out the case for and against in the company's own words. You can ask your own questions and get answers from the document.
- Listing Evidence does the same for IPOs in the US and the UK.
- What Investors Ask answers questions about companies already listed, from their own reports.
All three work in English and Hindi. You can type or speak your question and have the answer read aloud. Every review gets a second pass, and an independent reviewer checks it before we publish.
Our first US review: Anthropic. We reviewed Anthropic's filing of 10 November 2026 and published the review and an article on the case for and against on 15 November, three days before the price was set. The review put the strongest facts up front: revenue of $33.2 billion in nine months against $2.55 billion a year earlier, cash now flowing in from the business, and seven technology companies buying $26 billion of shares at the IPO price. It put the risks just as plainly: about $900 billion of committed spending, a return to an operating loss in the latest quarter, and control resting with the founders.
The shares were priced at $83, above the $70–$78 range, in an $81 billion sale, larger than SpaceX's $75 billion sale in June. They first traded at $111.50 and closed their first day at $97.17, up 17%. Our review did not forecast the price, and it never will. What it did was show investors, page by page, the facts the market went on to reward and the risks that still stand.
This article is for information and education only. It is not investment advice or a recommendation to buy, sell or apply for any security, and past listings say nothing certain about future ones. Please read the offer document carefully and consult a SEBI-registered adviser before investing.
How we did this
- Coverage. 456 mainboard IPOs listed on NSE and BSE from January 2021 to November 2026 (64 in 2021, 38 in 2022, 59 in 2023, 90 in 2024, 104 in 2025, 101 in 2026). SME IPOs are excluded.
- Bidding and listing data. End-of-day subscription by QIB, NII and retail as published by the exchanges (mostly via Trendlyne, gaps filled from Chittorgarh and others), the anchor allocation, and NSE listing-day open and close.
- Company data (294 IPOs listed 2024–26). Latest full-year revenue and profit, borrowing, net worth and company value at the issue price, from the offer documents as summarised on Chittorgarh. One IPO (Zetwerk) is missing because its source page could not be read.
- How a finding earns "Strong". At least 30 IPOs; right at least 80% of the time; at least 15 percentage points better than the average IPO; no year with 8 or more cases below 70%; and, found on 2021–24 data, still right at least 75% of the time in 2025–26. Because we tested many possible rules, we favoured simple single-factor rules.
- "Closed up" means the listing-day close was above the issue price, before costs and taxes.
- Anthropic's listing day: StockTitan live coverage; offer details from the company's pricing announcement of 18 November 2026.